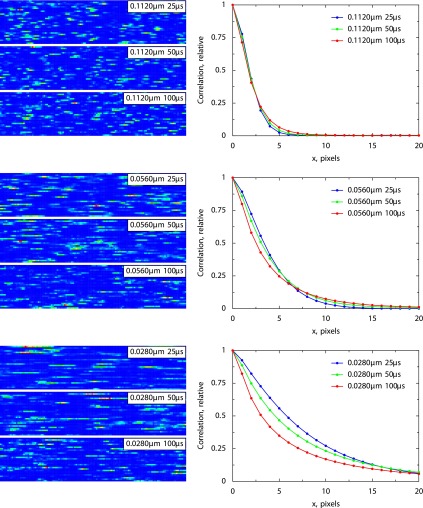
Fig. 3.
Simulated pseudocolor images (left) and autocorrelation functions (right) of point sources moving in 3-dimensional (3-D) solution. The presented autocorrelation functions are calculated for signal originating from the same line in the image, i.e., zero Δy displacement. In the simulations, the diffusion coefficient was taken as equal to 50 μm2/s. The autocorrelation function is normalized by the standard deviation of the signal, or the value at Δx = Δy = 0. Note how changes in pixel size (indicated in μm) and pixel time (in μs) modify the images and corresponding autocorrelation functions.

