
Fig. 9.
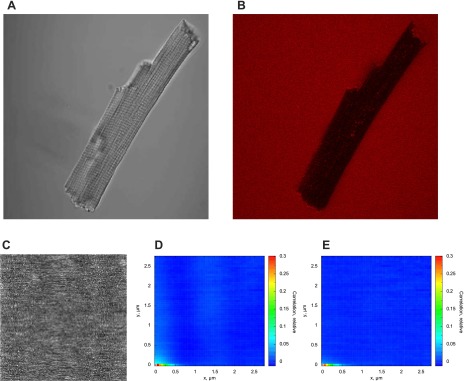
Representative images showing the different stages of the experiment and its analysis. An example transmission image of a cardiomyocyte (A) and a confocal image of the cardiomyocyte with Alexa-ATP added to the solution (B) before permeabilization of the cells by saponin. Note that before the addition of saponin, Alexa-ATP is mainly visible outside the cell and in long stripes within the cell, presumably t tubules. C: a confocal image of Alexa-ATP acquired for RICS analysis with a pixel size of 0.0558 μm and a pixel dwell time of 51 μs. The autocorrelation function calculated from the series of images acquired in the same conditions as C is shown before (D) and after (E) correction for average intensity in each pixel. Note that after the correction for average intensity of each pixel, the autocorrelation is considerably reduced for the pixels at the different lines of the image (Δy > 0).