
Table 1.
Diffusion constants derived from the raster image correlation spectroscopy at 22°C
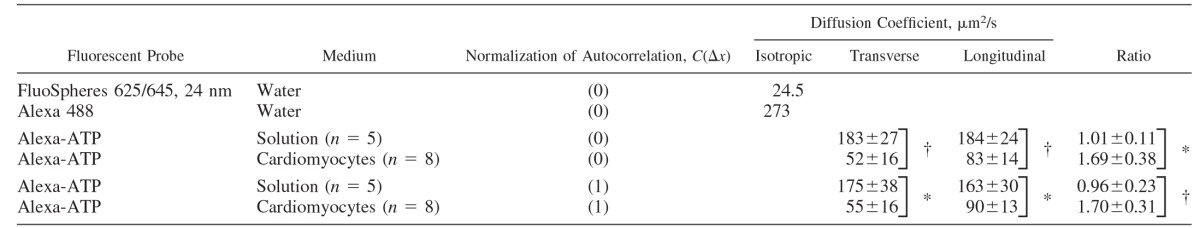 |
Values were obtained in water, measurement solution (solution), or cardiomyocytes. For Alexa-ATP, the diffusion coefficients derived for the longitudinal and transverse directions are shown as means ± SD. “Ratio” refers to the ratio of diffusion coefficients estimated for the longitudinal to the transverse direction (means ± SD). For measurement solution and cardiomyocytes, the analysis was performed with normalization of the autocorrelation function by C(0, 0) or C(1, 0), as explained in materials and methods (Eq. 5). C is shown depending on Δx (the distance between pixels along the fastest scanning direction of the laser) only, since in this work we considered the autocorrelation between pixels in the same line only. The difference between values determined for cardiomyocytes and solution were analyzed statistically using a t-test between the sets of data that were normalized the same way. *P < 0.01; †P < 0.001.