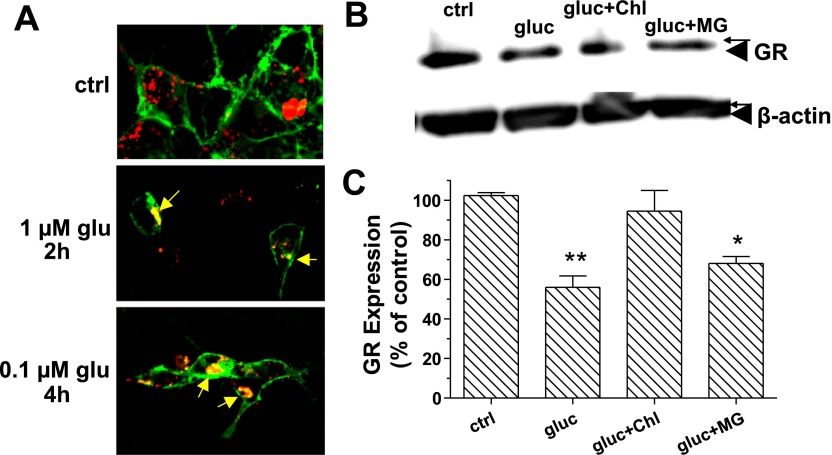
Fig. 6.
GR is degraded in lysosomes. A: HEK-293 cells were transfected with GR-green fluorescent protein. Lysosomes were labeled with Lysotracker Red as described in materials and methods and treated with the indicated concentration of glucagon (glu) for up to 4 h. Images were taken every 30 min. Representative images from 5–7 independent experiments are shown. B: HEK-GR cells were serum starved for 30 min and then treated with 25 μM cyclohexamide, without and with either 20 μM MG-132 (MG) or 200 μM chloroquine (Chl) for 30 min at 37°C, followed by 100 nM glucagon for 5 h at 37°C. Total lysates were prepared, and Western blot analysis was conducted as described in materials and methods. The image shown is representative of 3 independent experiments. C: protein levels for the anti-GR and anti-β-actin bands were determined by densitometric analysis using STORM phosphoimager and ImageQuant software. The amount of GR protein was normalized to the amount of β-actin in each lane, and the obtained values are expressed as percentage of control (nontreated cells). Data shown are means ± SE of 3 independent experiments. The data were analyzed by one-way ANOVA and Bonferroni posttest. *Significantly different from control: P < 0.05. **Significantly different from control: P < 0.01.

