
Fig. 2.
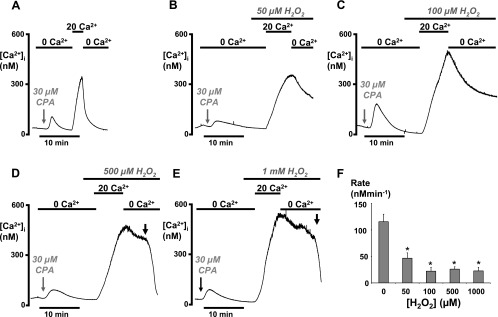
H2O2 (50–1,000 μM) inhibited PMCA activity under conditions in which mitochondrial Ca2+ uptake was inhibited. Pancreatic acinar cells were pretreated with 10 μM Ru-360 for 30 min, to inhibit mitochondrial Ca2+ uptake, immediately before the start of the [Ca2+]i clearance assay in all experiments. H2O2 was added 2–5 min before the addition of 20 mM external Ca2+. Representative traces show control cells (A) and the effects of 50 μM (B), 100 μM (C), 500 μM (D), and 1 mM (E) H2O2. Gray arrows indicate the point at which CPA was added, which was then present throughout the experiment. Black arrows in D and E show rapid loss of dye due to cell lysis. F: mean data showing the standardized linear [Ca2+]i clearance rate following treatment with varying concentrations of H2O2 (*P < 0.001, as assessed using an unpaired t-test).