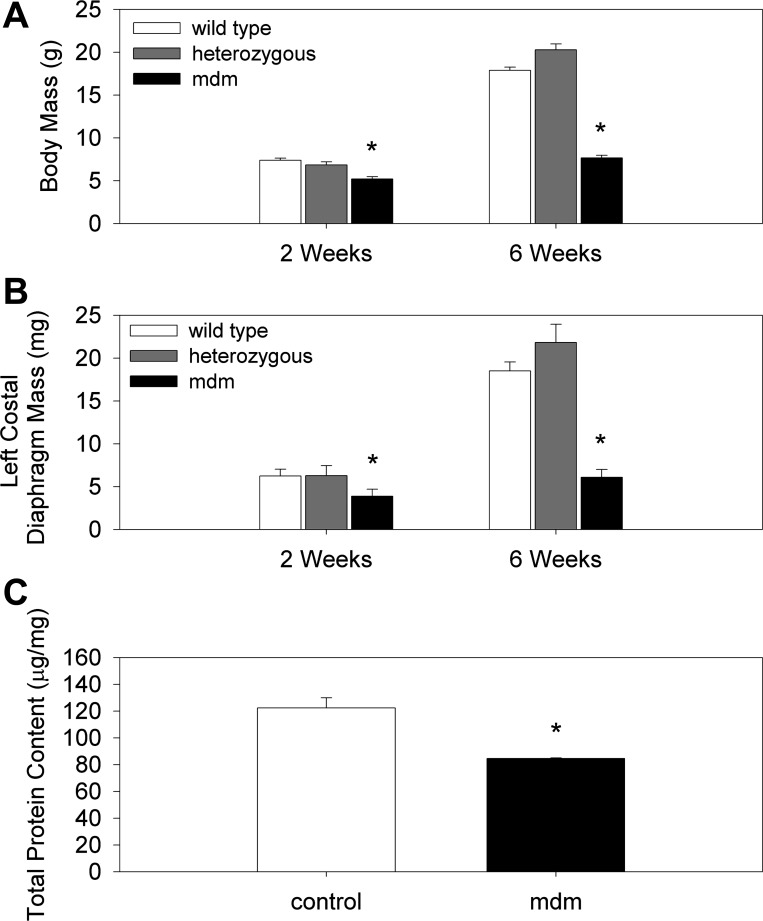
Fig. 3.
Whole body mass, costal diaphragm mass, and total protein content. A and B: mean whole body mass and left costal diaphragm mass of control and mdm mice at 2 and 6 wk (n > 20 for all groups). Decreases in total body mass (A) and left costal diaphragm mass (B) were statistically significant at 6 wk compared with controls. Reduction in diaphragm mass was slightly (10%) greater than whole body weight loss at 2 and 6 wk. C: total protein content per unit mass of muscle was significantly reduced (31%) in mdm compared with control mice at 2 wk (n = 3 per genotype). *P < 0.05 vs. age-matched controls.

