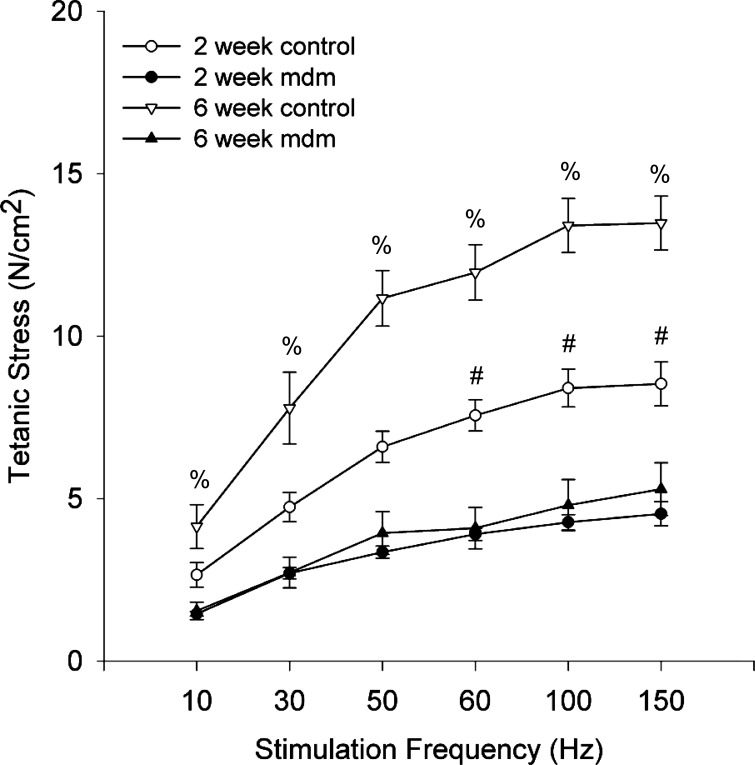
Fig. 8.
Mean costal diaphragm force-frequency response curves. At 2 wk, mdm diaphragm (n = 5) generated less tetanic stress than control (n = 9), with significance reached at 60, 100, and 150 Hz. At 6 wk, maximum tetanic stress was reduced 64% in mdm diaphragms (n = 5) relative to controls, with significance at all stimulation frequencies (#P < 0.05). All force-frequency response curves were nonlinear over the range of stimulation frequencies. %Statistically different from 2-wk and 6-wk mdm (P < 0.05).

