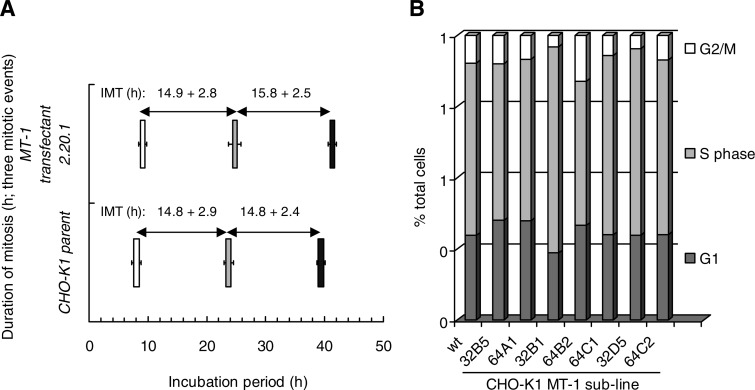
Fig. 2.
A: CHO-K1 cells and MT-1 transfectant 2.20.1 show similar durations for mitosis (value shown as width of bar; ±SD) and mean intermitotic times (IMT; ±SD) derived for individual cells tracked to first mitotic event (open bars), second mitotic event for a daughter cell (shaded bars), and third mitotic event for a granddaughter cell (solid bars). B: sublines of CHO-K1 MT-1 transfectant 2.20.1 show no abnormalities in cell cycle distributions as determined by flow cytometry. Data are derived from a single representative experiment (n = 2).

