Fig. 3.
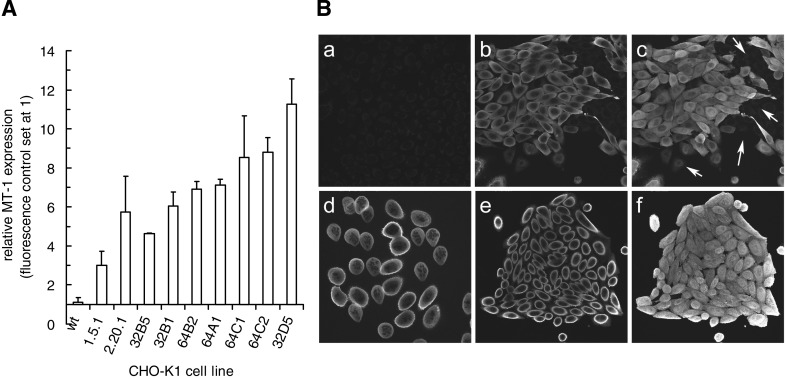
MT-1 expression and subcellular distribution in cell lines. A: MT-1 transfectants 1.5.1 and 2.20.1 and the subclones of 2.20.1 show a range of significantly elevated MT-1 levels as determined by flow cytometry. Data are ranked mean values (±SD) derived from 3 experiments. B: laser scanning confocal microscopy of MT-1 distribution in CHO-K1 (a), MT-1 transfectant 2.20.1 (b: optical section; c: projection), subclone 32D5 of 2.20.1 (d: optical of mitotic cells captured using colcemid treatment), and subclone 64C1 (e: optical section; f: projection). Images reveal the very low level of expression in WT CHO-K1 cells (a), heterogeneous expression in 2.20.1 (b and c; arrows indicate the presence of low expression cells), but homogeneous expression in subclones, irrespective of cell cycle stage (d–f). Panels are either maximal pixel projections of image stacks, or single optical sections (512 × 512 μm).

