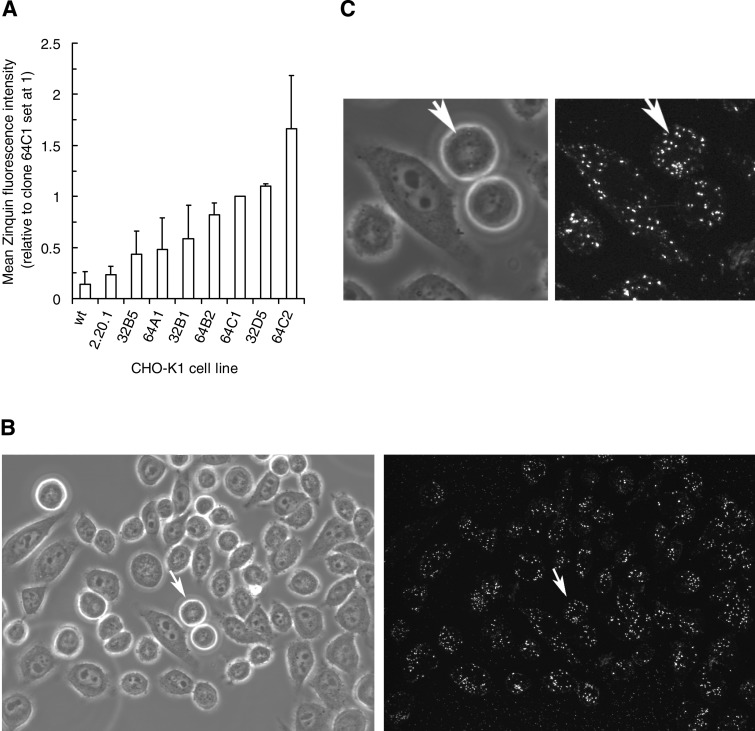
Fig. 4.
A: flow cytometric analysis of relative fluorescence of Zinquin in WT, MT-1 transfectant 2.20.1, and its subclones revealing the ranking of differential expression patterns. Data are ranked mean values (±SD) derived from 3 experiments. B: laser scanning confocal microscopy of Zinquin distribution in CHO-K1 MT-1 transfectant 2.20.1 subclone 64C2 showing typical punctuate cytoplasmic locations. Transmission (left) and fluorescence (right) images are 512 × 512 μm. C: detail of cell marked by arrows in B: transmission (left) and fluorescence (right).

