Fig. 3.
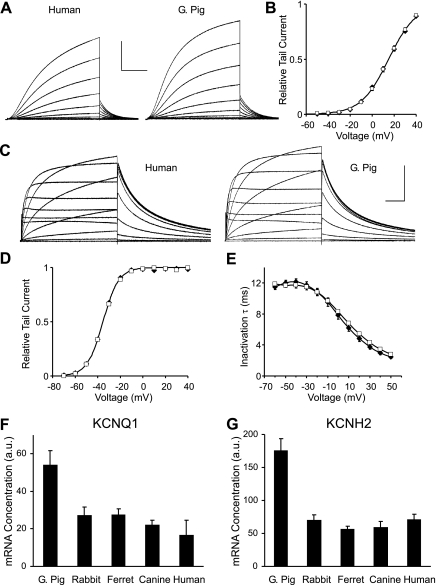
KCNQ1 and KCNH2 function and expression in Xenopus oocytes. A: current traces of human (left) and guinea pig (right) KCNQ1 channels coexpressed with KCNE1 (current scale: 4 and 2.5 μA, respectively, time scale: 2 s). B: activation curve determined from tail currents for human and guinea pig KCNQ1 (n = 10). Data points for human and guinea pig overlap. Data were fitted with Boltzmann curves [half-maximal potential (V1/2) = 14.9 ± 0.2 and 15.0 ± 0.3 mV, slope (k) = −12.2 ± 0.2 and −12.6 ± 0.3, respectively]. C: current traces of human (left) and guinea pig (right) KCNH2 channels (current scale 0.4 μA, time scale 1 s). D: activation curves (determined from tail currents) and inactivation time constants for human and guinea pig KCNH2 channels (n = 14 and 21, respectively). Data points for human and guinea pig activation curve overlap. Data were fitted with Boltzmann curves (V1/2 = −34.9 ± 0.3 and −35.3 ± 0.3 mV, k = −7.2 ± 0.2 and −7.0 ± 0.2, respectively). E: inactivation time constants (τ) for human and guinea pig KCNH2 channels. B, D, and E: values are means ± SE; □, human; ⧫, guinea pig. F and G: comparison of KCNQ1 (F) and KCNH2 (G) gene expression in the left ventricular free wall of guinea pig and larger species. Values are means ± SD (n = 3).

