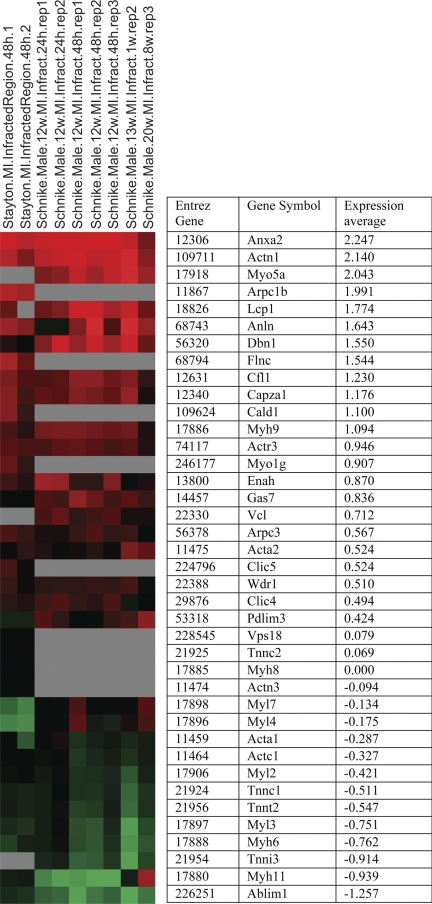
Fig. 4.
Expression of genes in module 519 (cytoskeleton and contractile elements). Red indicates positive number (induced vs. median), and green indicates negative expression (repressed). The samples shown include the infarcted region of MI. The average expression of the genes in these samples is written beside the graphical representation. The genes presented are sorted according to their average expression in these samples, which allows us to see the two expression trends: induced in module 519 (leukocyte-related genes) and repressed in this module (heart contractile genes).

