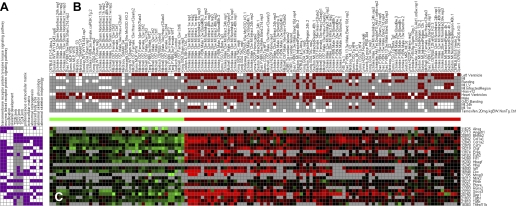
Fig. 5.
Module 29 (heart stress and matrix formation). This figure shows the gene sets that the genes of this module belong to (A), the attributes that the samples belong to (B), and the expression levels of the genes belonging to this module (C). The red/green bar indicates if the sample was identified as induced or repressed by the algorithm. The expression values are log-normalized, from 3 to −3 (fold change of 8 in the raw data).

