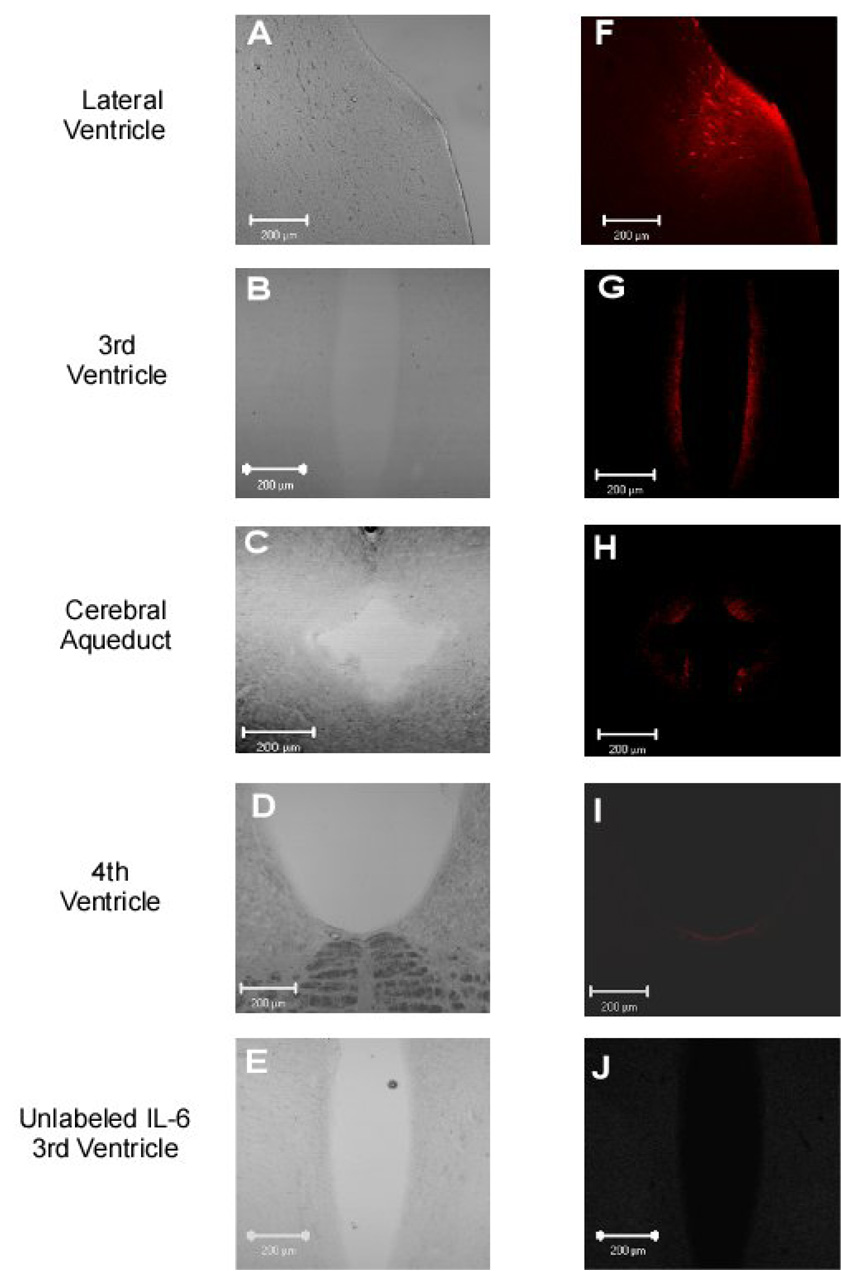
Figure 2.
IL-6 migration patterns through the ventricular system and associated periventricular tissue 60 minutes following icv injection of 100 ng of labeled IL-6. Images A-D are brightfield images at the level of the lateral ventricle, 3rd ventricle, cerebral aqueduct, and 4th ventricle (10x zoom), respectively. Images F-I show labeled IL-6 at the level of the lateral ventricle, 3rd ventricle, cerebral aqueduct, and 4th ventricle regions, respectively. Negative control images of unlabeled IL-6 are shown in Panels E (brightfield) and J (fluorescence) at the level of the 3rd ventricle. Scale bar is 200 µm.

