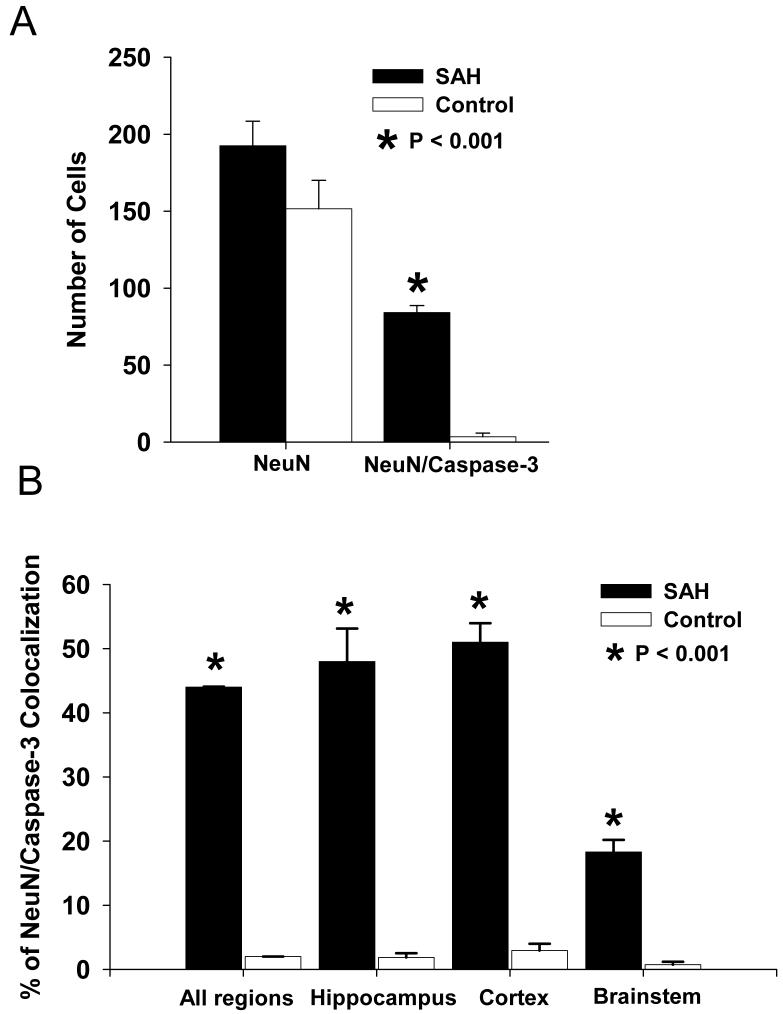
Figure 3. Quantification of NeuN/caspase-3 positive cells in 3 brain areas.
A: Bar graph showing no difference between control and SAH groups in the total number of NeuN-positive cells, but a significantly higher number of NeuN/caspase-3 labeled cells in the SAH group. B. Bar graph of regional analysis showing a significantly higher percentage of NeuN/caspase-3 co-localization in SAH animals compared to controls in all 3 regions investigated. Values are means ± standard deviations.

