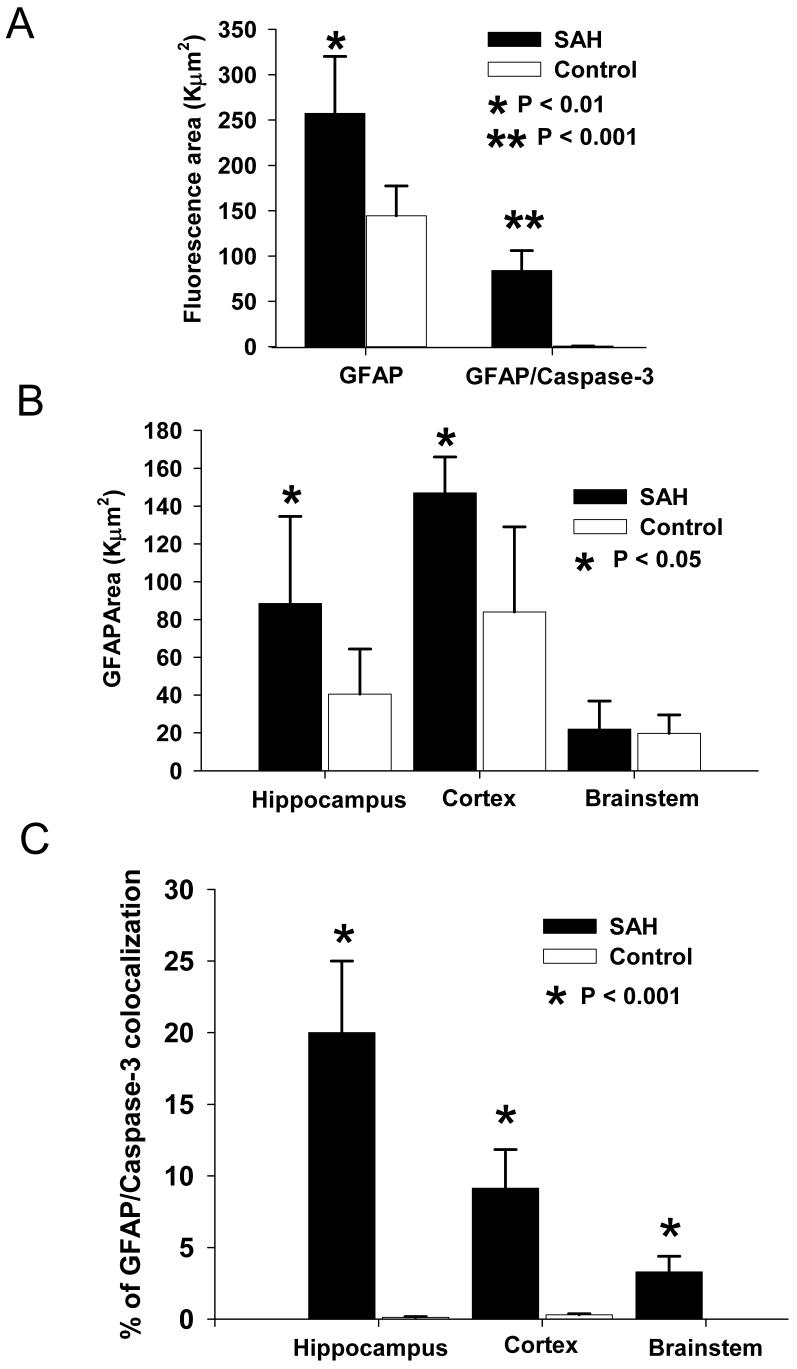
Figure 5. Quantitation of GFAP/caspase-3 immunoreactivity in 3 brain areas.
A: Bar graph of fluorescence area showing significant increased total area of GFAP positive staining as well as GFAP/caspase-3 double positive areas in the SAH group compared to controls. B: Total GFAP positive stained areas in SAH group were significant larger in hippocampus and cortex, but not brainstem as compared to controls. C. The percentage of area showing double immunoreactivity for GFAP and caspase-3 was significantly higher after SAH compared to control in all 3 regions. Values are means ± standard deviations.

