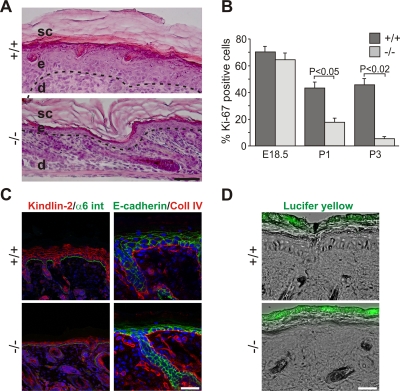
Figure 2. Atrophy and reduced proliferation in Kindlin-1−/− skin.
(A) H&E stainings from P3 backskin show severe epidermal atrophy in Kindlin-1−/− mice. The BM is indicated by a dashed line and separates the epidermis (e) from the dermis (d). sc: stratum corneum. Scale bar indicates 50 µm. (B) Percentage of Ki67-positive interfollicular keratinocytes, indicating proliferating cells, at different ages (n = 7 per genotype). Error bars show standard errors of the mean. (C) Kindlin-2 (red; co-stained with α6 integrin (α6 int; in green) and E-cadherin (green, co-stained with Collagen IV (Coll IV) in red) staining of P3 backskin sections. Nuclei are shown in blue. Scale bar indicates 10 µm. (D) FITC-Lucifer yellow stain of P3 backskin overlaid with DIC. Lack of lucifer yellow dye penetration shows normal skin barrier in Kindlin-1−/− mice. Scale bar indicates 50 µm.

