Figure 4.
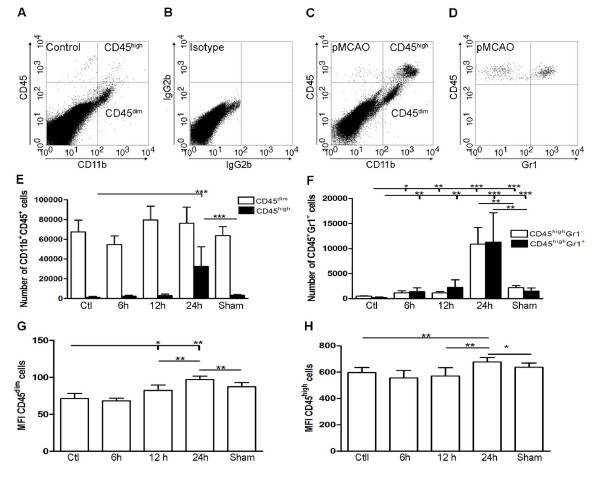
Inflammatory response following permanent MCA occlusion. (A-C) Dot plots of viable CD11b+CD45high macrophages/granulocytes (top right quadrants) and CD11b+CD45dim microglia (bottom right quadrants) in cortex from unmanipulated control mice (A, B), and mice exposed to pMCAO with 24 hour survival (C). (D) At 24 hours, flow cytometric analysis of the CD11b+CD45high profiles showed that approximately half of the population consisted of CD45highGr1+ granulocytes. (E) Quantification of CD11b+CD45dim and CD11b+CD45high cells in unmanipulated control mice (n = 10), in mice 6 (n = 7), 12 (n = 7), or 24 hours after pMCAO (n = 10), and in sham-operated mice 24 hours after pMCAO (n = 7). (F) Bar graphs showing equal recruitment of CD11b+CD45highGr1- macrophages and CD11b-CD45highGr1+ granulocytes in unmanipulated mice, in mice 6, 12, or 24 hours after pMCAO, and in sham-operated mice 24 hours after pMCAO. (G, H) Bar graphs showing the mean fluorescent intensity (MFI) of CD45 expression by CD45dim microglia (G) and CD45high macrophages/granulocytes (H). *P < 0.05, **P < 0.01, and ***P < 0.001.

