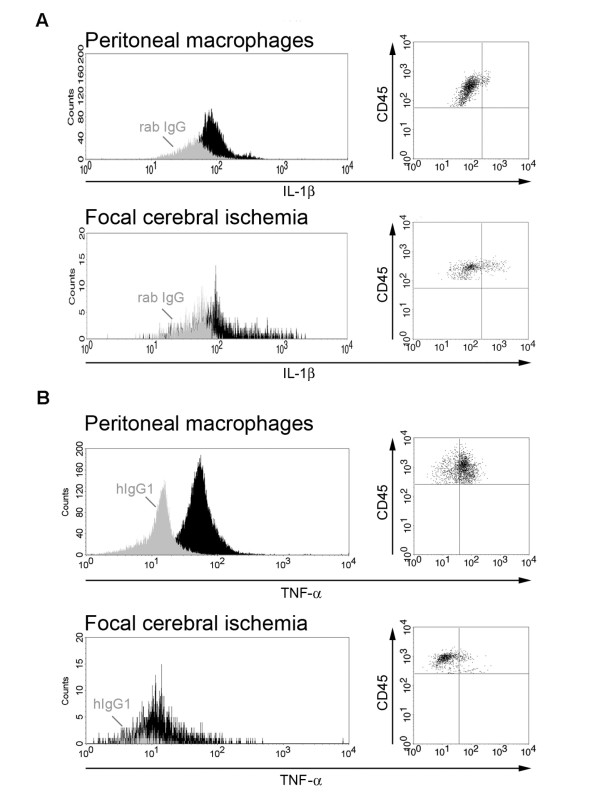
Figure 6.
Sensitivity of cytokine detection using flow cytometry. Histograms and dot plots of IL-1β (A) and TNF-α (B) expression in LPS-activated peritoneal macrophages versus macrophages/granulocytes isolated from cortex 24 hours after pMCAO. Light colored histograms represent cells stained with isotype control antibodies and filled histograms represent cells stained with antibodies for either IL-1β (A) or TNF-α (B).

