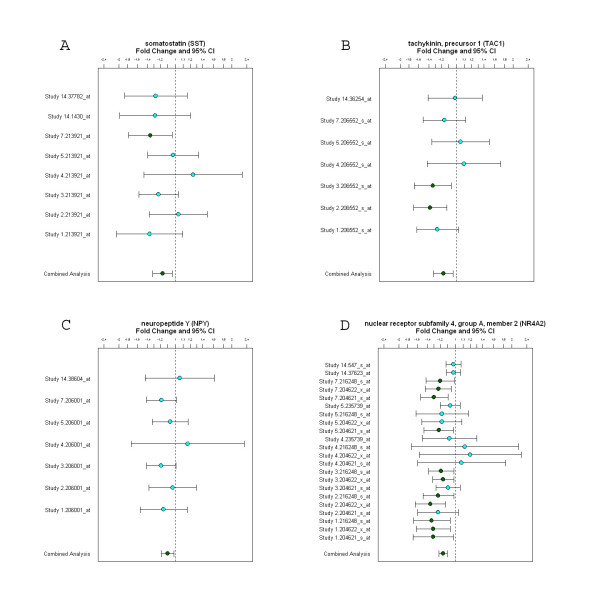
Figure 2.
Decreased gene expression of neuropeptides in the cross-study analysis of psychosis. A: somatostatin, B: tachykinin, precursor 1, C: neuropeptide Y, D: NR4A2. The plots with fold change and 95% confidence intervals show consistent down-regulation across multiple individual studies. Combined analysis shown on the bottom of each panel represents the weighted fold change and 95% confidence intervals for each gene.

