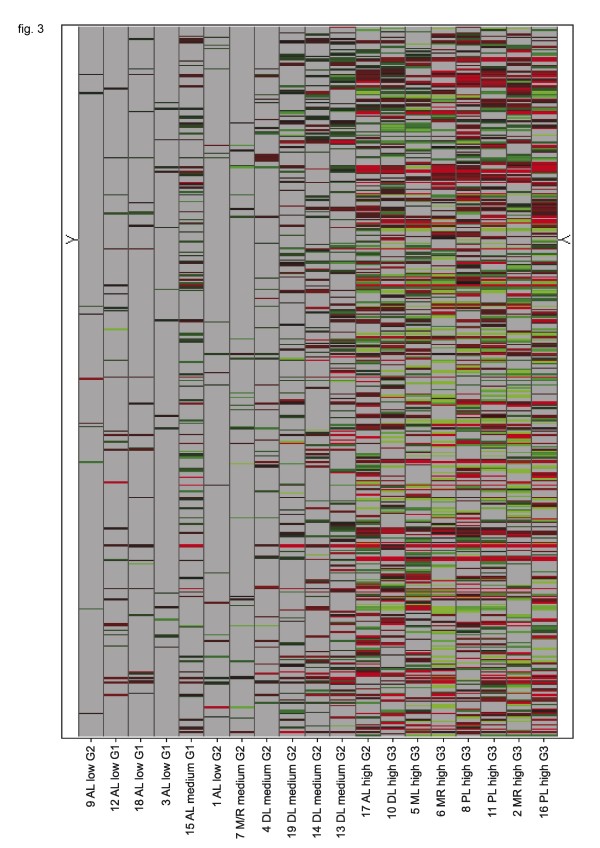
Figure 3.
Heatmap of expression changes of genes related to apoptotic pathways after incubation with doxorubicin for 24 h. Horizontal rows represent individual genes; vertical columns represent individual samples (left to right: low responders to high responders). Color range: Brightest red (Change call increased (change p-value < 0.002) and Signal Log Ratio > 1): SLR = >2 (4× or higher), Black: SLR = 0 (no change); not visible as a consequence of the filtering process, Brightest green (Change call decreased (change p-value > 0.998) and Signal Log Ratio < -1): SLR < -2 (0.25× or smaller). Grey: no value (requirements for a reliably measured target not met). Calculated in Affymetrix comparison analysis (MAS5.0 algorithm) and at least one present call in the two síngle array analyses compared in the comparison analysis.

