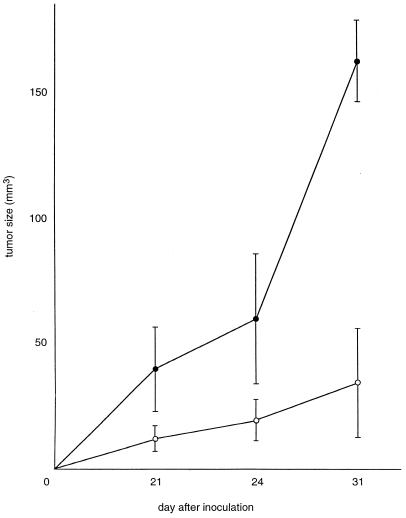
Figure 6.
Tumor growth in nude mice. Rat 1a-p40AIS cells (●) developed into significantly larger tumors compared with Rat 1a-no (○) cells at day 21 (P = 0.0218, t test), day 24 (P = 0.0265), and day 31 (P < 0.0001). Each curve represents the mean (±SD) volume of four tumors as shown. On day 31, Rat 1a-p40AIS tumors averaged 162.8 ± 14.8 mm3, whereas Rat 1a-no tumors averaged 35.0 ± 21.8 mm3.

