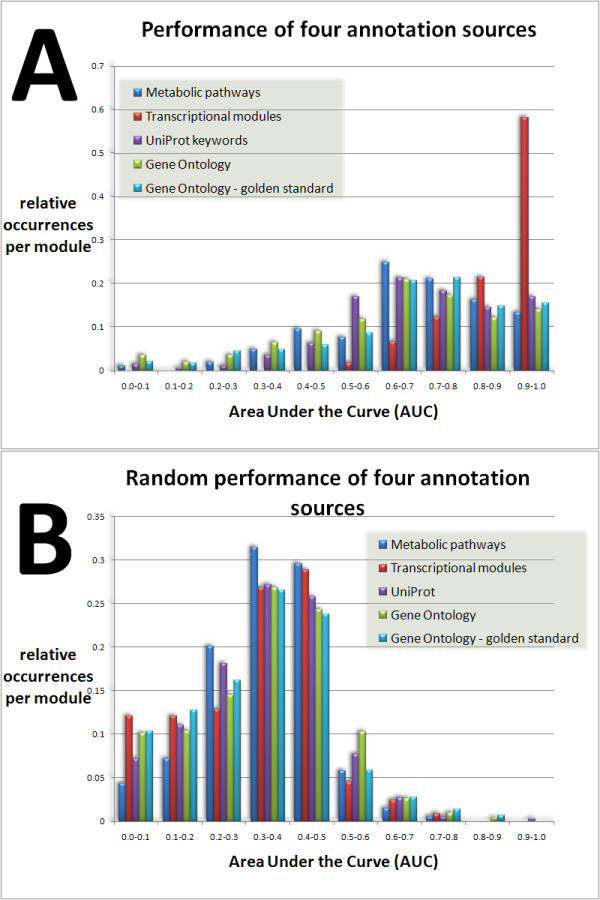
Figure 3.

Prediction ability of four annotation sources. Histograms of ROC areas (Area Under the Curve) for four annotation sources for E. coli based on 305 microarrays (3A) compared to randomized results (3B). The real data reveal a large amount of categories with AUC values larger than 0.8, which are almost absent in randomized results. These categories are the most promising candidates for which the iGBA approach will enable confident gene assignments functional predictions. Analysis of the AUC distribution across the annotation sources shows that the "transcription module" annotation source is the most informative, i.e., contains the largest amount of categories exceeding an AUC value of 0.9 (3A). This is intuitively very convincing as shared transcriptional regulation is the basis of coexpression. In addition to ROC areas for all GO terms, we have also analyzed the distribution of ROC areas for the GO annotation source using the "gold standard" [28]. This proposed "gold standard" (GS) consists of a specific trusted set of biological processes that maps proteins to well-defined functional classes to evaluate predictions. The authors supply a set of biological processes that is based on selection by a panel of biology experts. We have included AUC results for the GO annotation for E. coli using the GS. Analysis of the AUC distributions shows that the distribution of relative occurrences of the GS analysis and the analysis using a fixed member cutoff is comparable.
