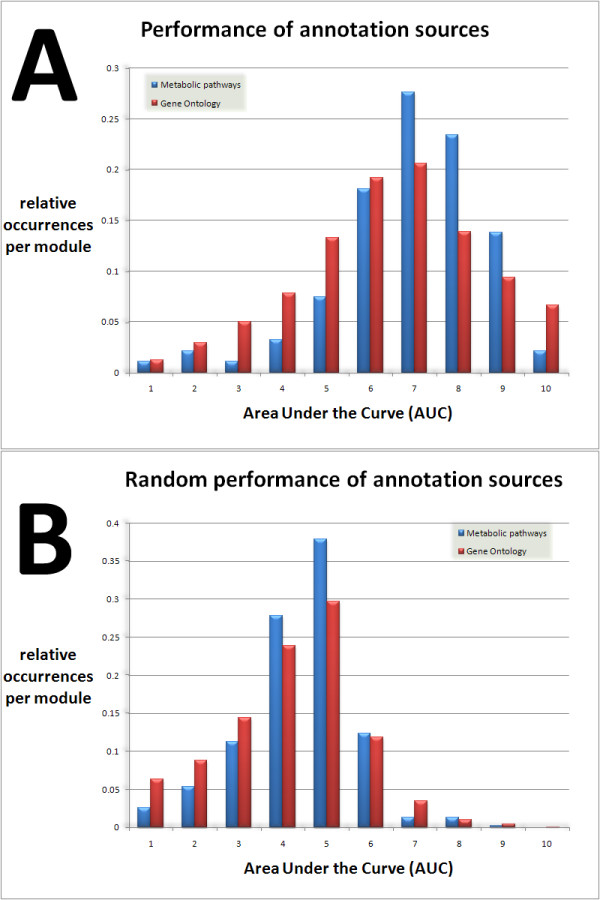
Figure 4.

Prediction ability of two annotation sources for yeast. Histograms of ROC areas (Area Under the Curve) for two annotation sources (Gene Ontology and metabolic pathways) for S. cerevisae based on 1079 datasets from Stanford microarray database (4A) compared to randomized results (4B). The real data reveal a large number of categories with AUC values larger than 0.8, which are almost absent in randomized results. These categories are the most promising candidates for which the iGBA approach will enable confident gene assignments of functional predictions.
