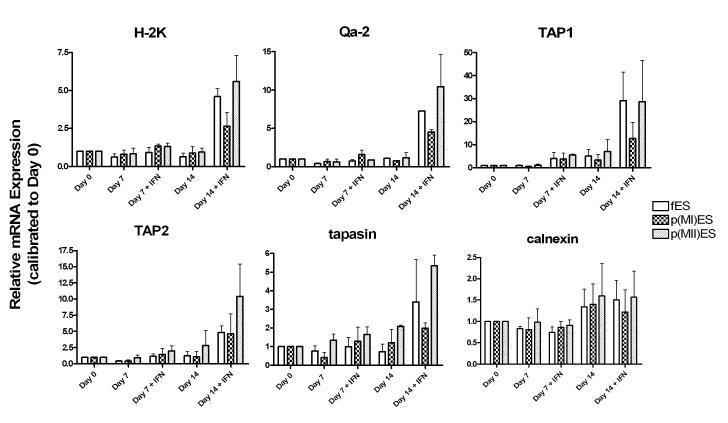
Figure 2.
MHC class I and antigen processing chaperone mRNA expression in ES cells derived from fertilized (fES) and parthenogenetic [p(MI)ES and p(MII)ES] embryos. A quantitative analysis of relative mRNA expression was performed using Real Time PCR for six genes on undifferentiated (day 0) and differentiating (day7 and day 14) ES cells. On days 7 and 14, the effect of interferon-γ (IFN) treatment was also analyzed. Data are representative of triplicate samples from n=2 experiments. Note that the Y-axis scales differ between the different genes analyzed.

