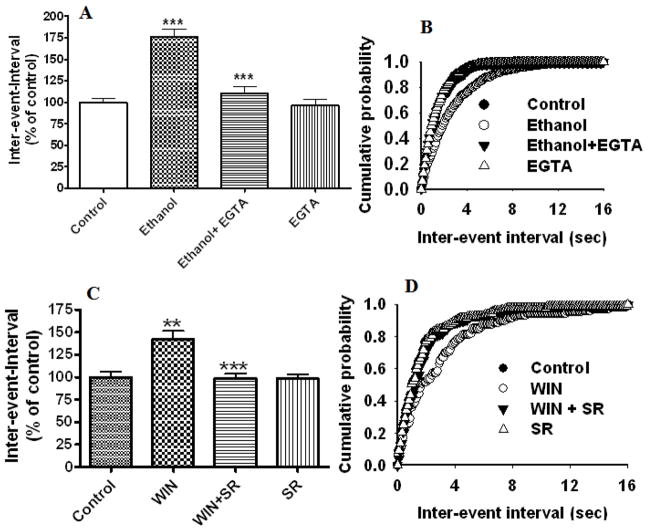
Fig. 4.
Postsynaptic perfusion of EGTA into the postsynaptic neuron rescues the ethanol-induced depression of mEPSC frequency and bath application of CB1 receptor antagonist rescues WIN 55, 212-2 –induced suppression of mEPSC frequency. (A) Combined plots showing the perfusion of EGTA into the postsynaptic neuron antagonized the ethanol-induced depression of frequency (increased inter-event intervals) (p<0.0001) (n=6 neurons). EGTA alone has no significant effect on mEPSC frequency. (B) Average cumulative distributions showing significant inhibition of the ethanol-induced depression of mEPSC inter-event intervals (sec) relative to ethanol by postsynaptic perfusion of EGTA (p < 0.01; Kolmogorow-Simrnov two-sample test). (C) Combined plot showing the bath application of WIN55,212-2 suppresses mEPSC frequency without affecting the amplitude. SR141716A antagonized the WIN 55,212-2-induced depression of mEPSC frequency. SR141716A alone does not significantly affect mEPSC frequency and amplitude. (D) Average cumulative distributions of mEPSC inter-event interval (sec) showing a decrease in mEPSC frequency in WIN 55,212-2-treated cells relative to control (n = 6 neurons). (p < 0.01; Kolmogorow-Simrnov two-sample test).

