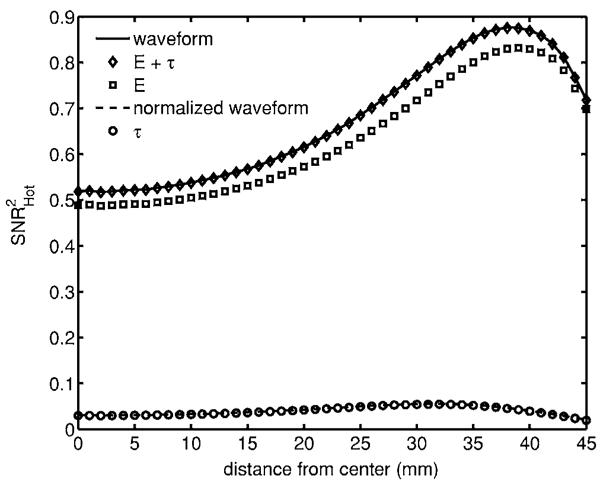
Fig. 4.

Detectability of μa,+ signal1 in a flat background. Note that the normalized waveform and τ plots overlap. For an attenuating inclusion in a flat background, the majority of the information is encoded by the total counts. Peak detectability occurs close to the boundary.
