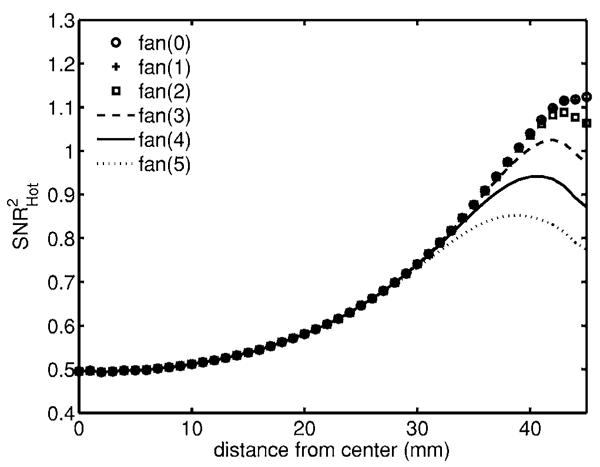
Fig. 7.

Detectability for μa,+ lesion and the E data type in a flat background. Each curve represents exclusion of a different number of detectors at either side of each source. Note that using all detectors [fan(0)] and only excluding one [fan(1)] produces plots that lie on top of each other.
