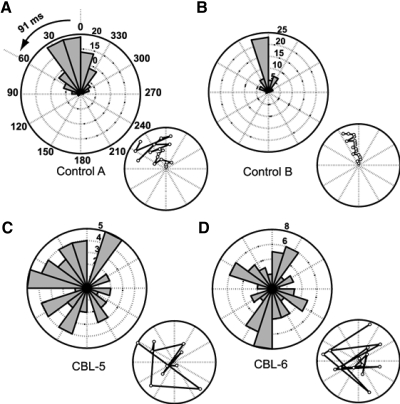
FIG. 4.
Polar histograms of pacing dot location at movement start. A–D: individual example subject data, with all trials in the discontinuous, constant paced condition shown. Bar magnitude represents number of movement cycles. A and B: 2 control examples that had significant preferred directions using the Rayleigh test (z scores: 59.6 and 37.4) and used predictive strategies (i.e., started while the dot was within the first 60°). C and D: 2 cerebellar examples with no preferred direction (z scores: 2.96 and 0.25). Inset plots show the pacing dot location at movement start from cycle to cycle in a single trial. Open points represent the dot position from each cycle with the first cycle at the center and subsequent cycles radiating out. A spiral pattern would occur if subjects were continually lagging behind on each subsequent cycle. This was typically not the case.

