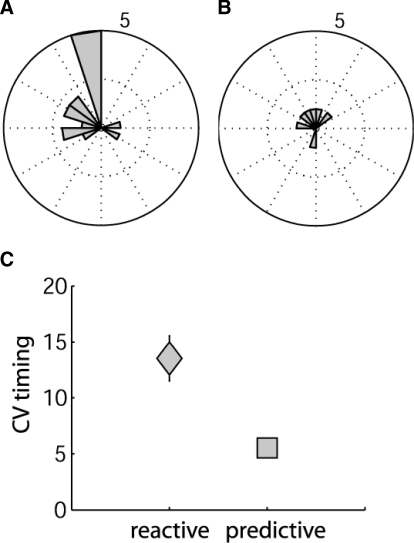
FIG. 5.
Cases showing directionality. Polar plot bar magnitudes represent the number of cases showing directionality by the Rayleigh test (i.e., 8 subjects moving in any of the 3 paced conditions for discontinuous movements; 24 possible cases). A: controls showed directionality 15/24 times, with 9 cases that were classified as predictive. B: cerebellar subjects showed directionality 6/24 times, with 4 cases that were classified as predictive. C: mean CV of timing for pooled control and cerebellar subjects who showed reactive (gray square) vs. predictive (gray triangle) behavior. Predictive behavior was less variable in timing than reactive behavior (t = 2.4, P = 0.02; note: reactive here includes nondirectional trials). This effect was also present when the groups were considered in isolation, although much more robustly for the cerebellar group (controls: reactive CV = 6.7 ± 0.6; predictive CV = 5.6 ± 0.7 vs. cerebellars: reactive CV = 18.6 ± 3.0; predictive CV = 5.4 ± 0.5).

