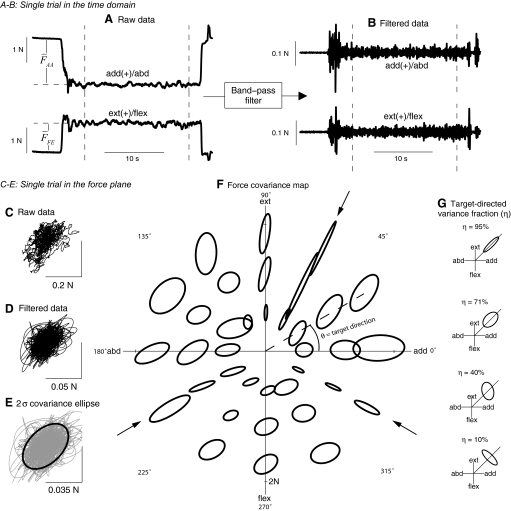
FIG. 3.
Construction of force covariance map with representative data. A: raw force traces in abduction/adduction and flexion/extension. Subjects produced ramp-and-hold forces to a specified magnitude and direction, holding for 10–20 s. B: noise-like fluctuations were emphasized by band-pass filtering data. Data were cropped to include only the steady hold interval, indicated between the vertical lines in A and B. C: raw force fluctuations during the hold interval, plotted in the abduction–adduction/flexion–extension plane. D: band-pass filtered force fluctuations. E: covariance of force variability, plotted as a σ ellipse, representing the data covariance matrix. F: covariance ellipses plotted for every trial from one representative subject. The center of the ellipse indicates the average force vector produced during the trial; the target direction θ is the angle between the average force vector direction and the adduction axis. The ellipses are magnified by a factor of 25 for visualization. G: alignment between ellipse and target direction is quantified using the target-directed variance fraction η, the fraction of total variance that occurs in the direction of the target force. Various hypothetical force covariance ellipses are shown along with the corresponding η value, where the diagonal ray indicates the target direction.

