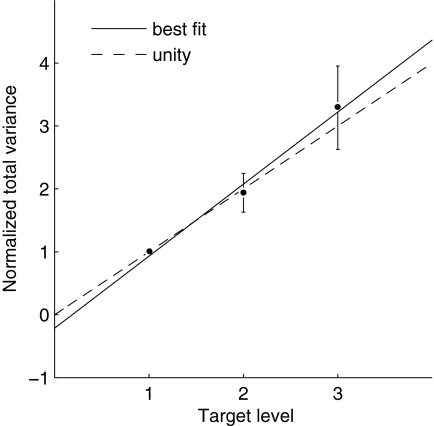
FIG. 4.
Endpoint force variability exhibits signal-dependent noise. Total force variance, normalized to the lowest target level, plotted vs. target magnitude level. Variance increased with target level (P = 0.00001), as would be expected with signal-dependent noise. Error bars indicate 95% confidence intervals for the mean and the best-fit line, determined by linear regression, is shown.

