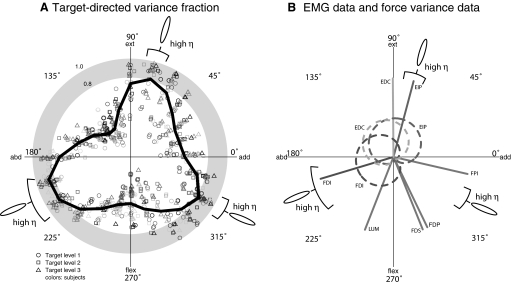
FIG. 6.
Force covariance map relates to muscle activity and action direction. A: relation between force covariance ellipses and the target force direction, as quantified by the target-aligned variance fraction (η). Each point represents a target, with direction given by the target direction, and magnitude given by η. Different target magnitude levels are represented by different symbols, whereas different subjects are represented by different colors. On top of the subject population data is a thick curve showing η averaged across subjects and target levels within each 15° bins of target direction. Averaged η exceeds a 0.8 threshold in 3 ranges of target directions, giving target direction ranges that had “high” η corresponding to target-directed covariance ellipses. B: the regions of target directions exhibiting target-directed and non-target-directed covariance were compared with muscle activity tuning curves for muscles recorded from and action directions from all muscles (lines).

