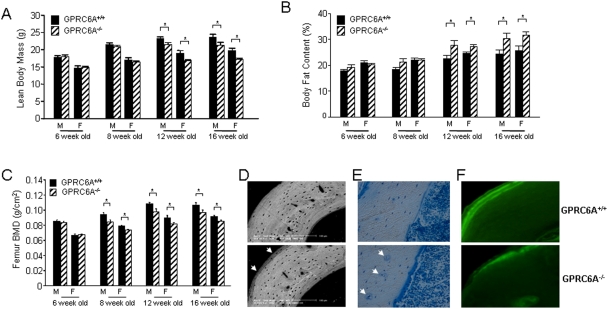
Figure 6. Characterization of the bone phenotype of GPRC6A −/− mice.
(A–C) Comparison of the lean body mass (A), fat content (B) and bone mineral density of the femur analysis (C) by PIXImusTM analysis in GPRC6A +/+ and GPRC6A −/− mice at ages ranging from 6 to 16 weeks. Data represent the mean±SEM from 6 to 10 mice in each group. * Significant difference from GPRC6A+/+ and GPRC6A −/− mice at p<0.05. (D) Backscattered Scanning Electron Microscopy analysis of tibia cortical bone in 16-week-old GPRC6A+/+ (upper panel) and GPRC6A −/− mice (lower panel). The arrows showed the diminished mineralization layer in the bone of GPRC6A −/− mice. (E) Toluidine blue-stained plastic sections of femur from 16-week-old GPRC6A+/+ (upper panel) and GPRC6A −/− mice (lower panel). The arrows showed the unmineralized osteoid surfaces in the bone of GPRC6A −/− mice. (F) Plastic unstained sections of tibia cortical bone viewed under fluorescent light in 16-week-old GPRC6A+/+ (upper panel) and GPRC6A −/− mice (lower panel) prelabeled with twice calcein (double label).

