
FIGURE 4.
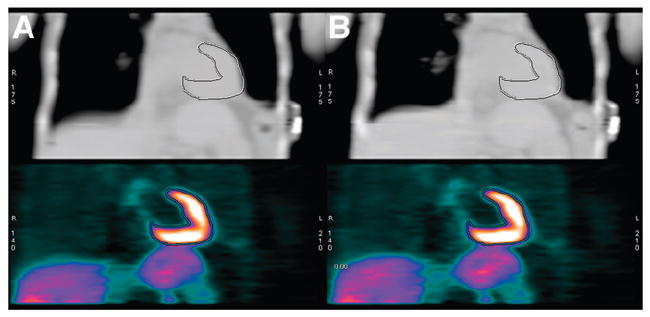
Coronal slice through patient example of aligned CT and PET images. At top are average (A) and intensity maximum (B) of 1 set of cine CT data. Top row was used for attenuation correction of PET images in bottom row.
Official websites use .gov
A
.gov website belongs to an official
government organization in the United States.
Secure .gov websites use HTTPS
A lock (
) or https:// means you've safely
connected to the .gov website. Share sensitive
information only on official, secure websites.
Coronal slice through patient example of aligned CT and PET images. At top are average (A) and intensity maximum (B) of 1 set of cine CT data. Top row was used for attenuation correction of PET images in bottom row.