
Fig. 2. Centrifugation of cell suspensions.
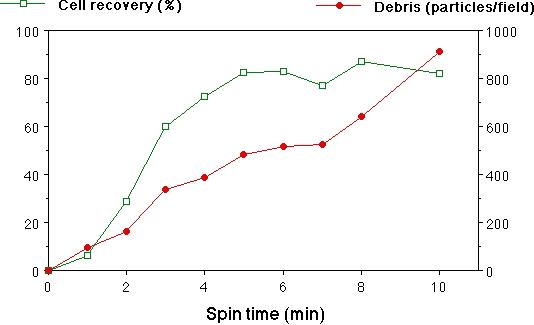
A. Spin-time vs. cell recovery and debris counts. Cells and debris from whole cerebral hemispheres of newborn rats, in 2 mL of suspension, were centrifuged through 0.5 mL of a 5% BSA solution, and cells and debris were quantified as described in Materials and Methods. Although recovery of cells at 2 min was only about 30%, we found unacceptable amounts of debris in samples spun for longer. The majority of the debris was still in the supernatant fraction after 10 min, hence the approximately linear increase in debris with spin time. Means of duplicate spins are plotted, with error bars indicating the range.
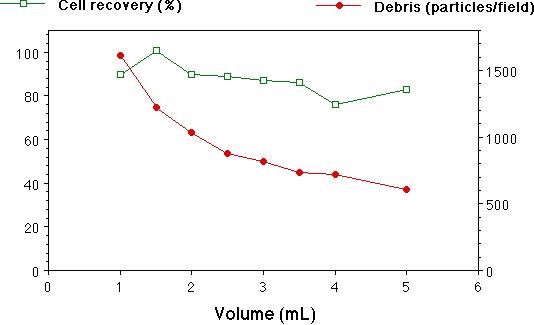
B. Volume of suspension vs. cell recovery and debris counts. All samples were spun for 6 min. Means+/-SEM of triplicate spins are plotted.