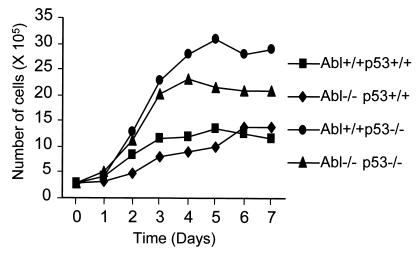
Figure 4.
Growth curves of embryo fibroblasts of defined genotypes. Early-passage embryo fibroblasts were plated (3 × 10⁵ cells per 6-cm dish in duplicate) on day 0. Cells were counted on days 1–7. Each data point is a mean of three or four experiments involving fibroblasts isolated from two separate embryos for each genotype.

