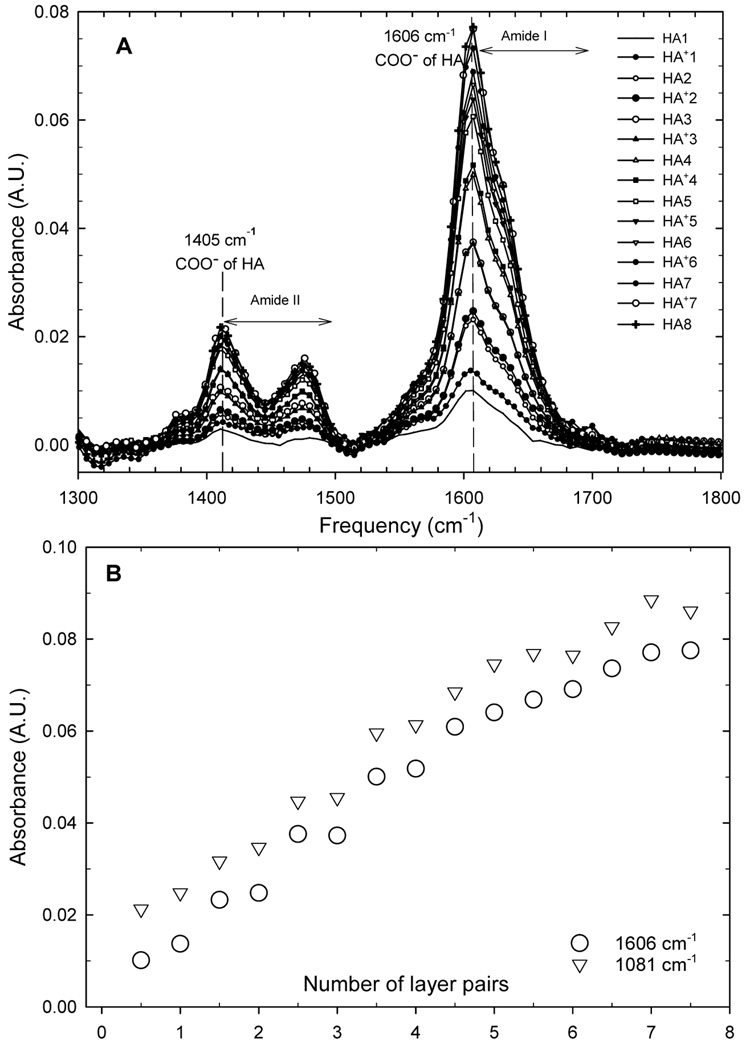
FIGURE 5.
(A) ATR-FTIR spectra of a PEI-(HA/HA+)7-HA film during its buildup. The spectra are taken after each HA and HA+ adsorption (after the rinsing step). The carboxylic peaks (1606 and 1412 cm−1, respectively) and the amide I and II bands (1600–1675 and 1400–1500 cm−1, respectively) can be seen. (B) The evolution of the absolute values of the absorbance at 1606 cm−1 (○, carboxylic peak) and 1081 cm−1 (▽, saccharide peak) is represented as a function of the number of deposited layer pairs.

