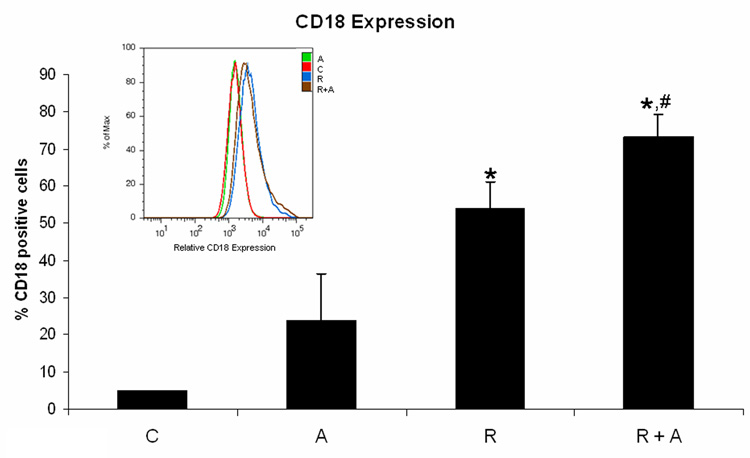
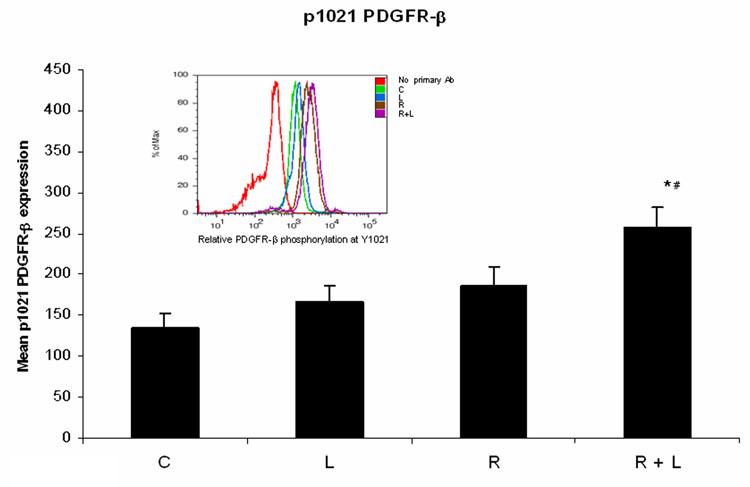
Figure 4. Inhibiting PDGFR enhances integrin 2β expression while activating integrin enhances PDGFR-β phosphorylation.
Panel (A) depicts integrin 2β expression following treatment with RA plus or minus AG1296 for 48 h. Panel (B) shows PDGFR-β Y1021 phosphorylation in HL-60 cells following treatment with RA plus or minus integrin αMβ2 ligand for 72 h. Shown are means with error bars representing standard errors of means from 3 independent experiments. The insert shows PDGFR-β Y1021 phosphorylation histograms for a typical experiment. (*) indicates treatment groups that were significantly different from control and (#) indicates RA plus AG1296 treated groups that were significantly different from cells receiving RA only. C, control; A, 10 µM AG1296; R, 2 µM retinoic acid; R + A, 10 µM AG1296 plus 2 µM retinoic acid; L, 5 µM integrin αMβ2 ligand; R + L, 5 µM integrin αMβ2 ligand plus 2 µM retinoic acid.


