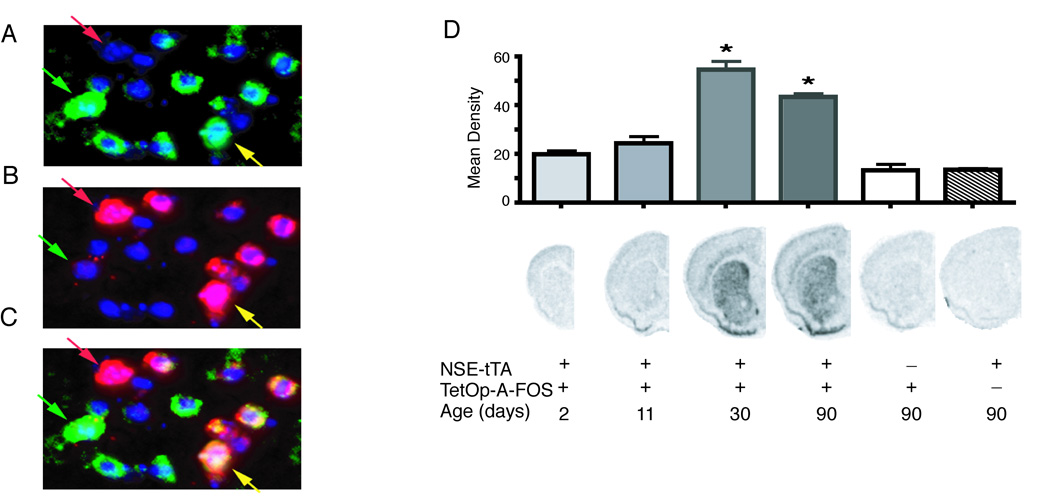
Fig. 2.
Striatal localization and developmental expression of A-FOS mRNA. Double fluorescent in situ hybridization was performed on brain sections from adult mice containing both NSE-tTA and TetOp-A-FOS alleles. The A-FOS antisense probe (A) was labeled with Cy3 (green labeling) while the enkephalin antisense probe (B) was labeled with Cy5 (red labeling). (C) The composite image of A-FOS and enkephalin labeling. For all images the nuclei are stained blue using a DAPI counterstained. The green arrows indicate an enkephalin negative neuron (likely a direct projecting striatal neuron) positive for A-FOS whereas the yellow arrow indicates a neuron positive for both enkephalin (indirect projecting striatal neuron) and A-FOS. The red arrows identifies an enkephalin positive neurons that did not express A-FOS. A-FOS expression was observed in a majority of enkephalin positive cells and in a similar number of enkephalin negative cells. (D) A-FOS mRNA expression in the striatum during development was determined by in situ hybridizations with a radiolabeled A-FOS antisense probe of brain sections from transgenic mice at 2, 11, 30 and 90 days after birth. The labeling density over the striatum was determined using digitized images and the mean density of each group (5 to 8 animals each) is indicated in the graph plus standard error. The presence of the NSE-tTA or TetOp-A-FOS allele is indicated with “+” below the example images along with the age. * = p<0.001 relative to NSE-tTA only containing adult controls. (Tukey’s multiple comparison test following 1-way-ANOVA)

