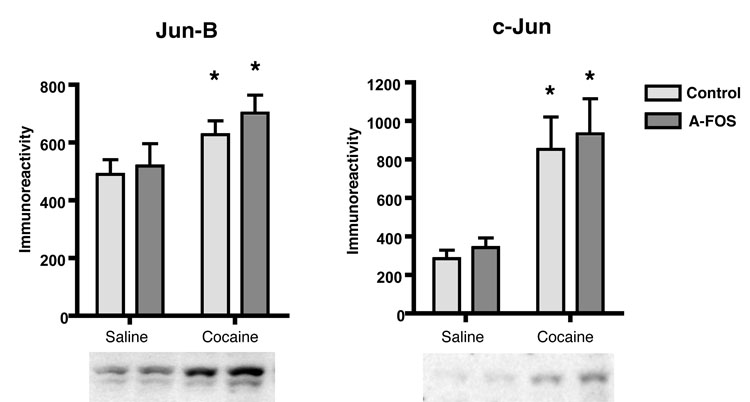
Fig. 4.
Jun protein levels in A-FOS expressing mice. Jun-B and c-Jun protein levels in the striatum were determined by western blotting and chemiluminesense. The autoradiographic films were digitized and a density plot for each protein lane was produced. The area under the plot line for each band was used to compare relative protein concentrations in each sample and displayed as the mean immunoreactivity plus standard error for each group. Cocaine produced a significant increase in both Jun-B (*p<0.01) and c-Jun (* p<0.001) protein levels as determined by 2-way-ANOVA. There was no significant affect of A-FOS expression on the levels of Jun-B and c-Jun protein expression.

