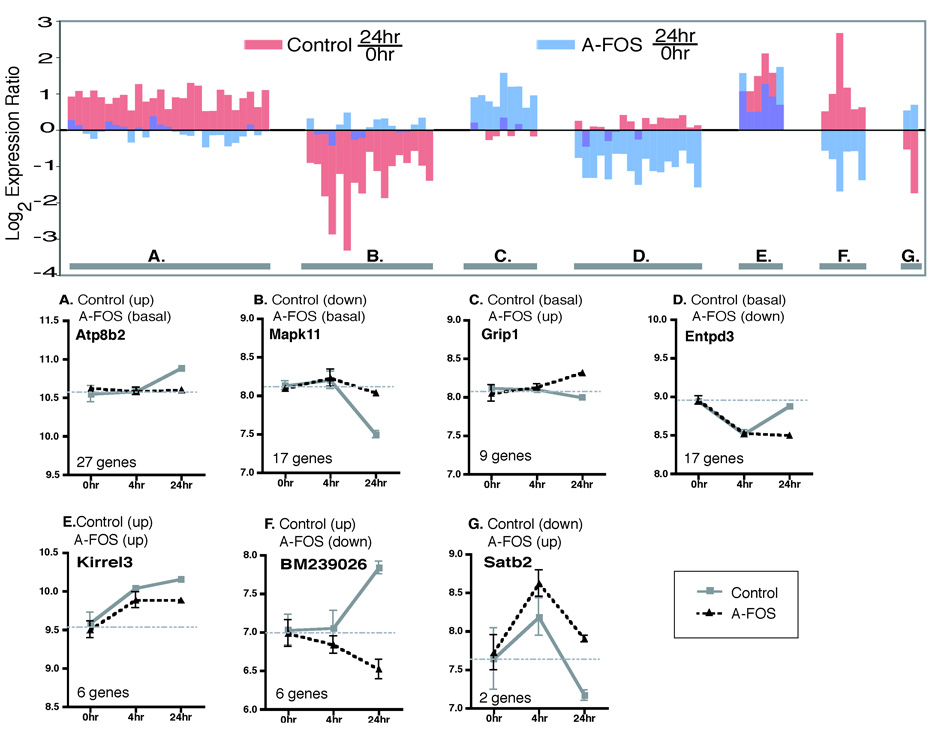
Fig. 5.
A-FOS affected gene expression 24 hours after cocaine. The chart displays the the 84 genes identified as significantly (p<0.001) altered by A-FOS expression along the x axis showing the log2 expression ratios of both the control mice (red) 24 hours/0 hour (saline) and A-FOS mice (blue) 24 hours/0 hour. The 84 genes were divided into 7 groups depending on their 24 hour versus basal expression levels (saline). The 7 groups (A–H) are indicated on the graph by the lower gray bar with individual examples shown below. The lower examples from each group display the mean log expression values plus standard errors from the Affymetrix chip data for both A-FOS expressing and control mice at 0, 4, and 24 hours after a single injection of cocaine. The horizontal gray bar indicates the average expression value of the 0 hour time point (basal expression) for each gene. The example charts also give the official gene symbol for the each gene (from the National Center for Biotechnology Information Entrez Gene Database) shown along with the number of genes in each group. Groups A and B contain genes in which their normal cocaine altered expression was blocked by A-FOS expression. Groups C and D contain genes in which cocaine altered their expression at 24 hours only in A-FOS mice and not in controls. Group E contains genes in which the level of cocaine induced expression was modified by A-FOS expression, while groups F and G contain genes whose expression was reversed by A-FOS expression 24 hours following cocaine.

