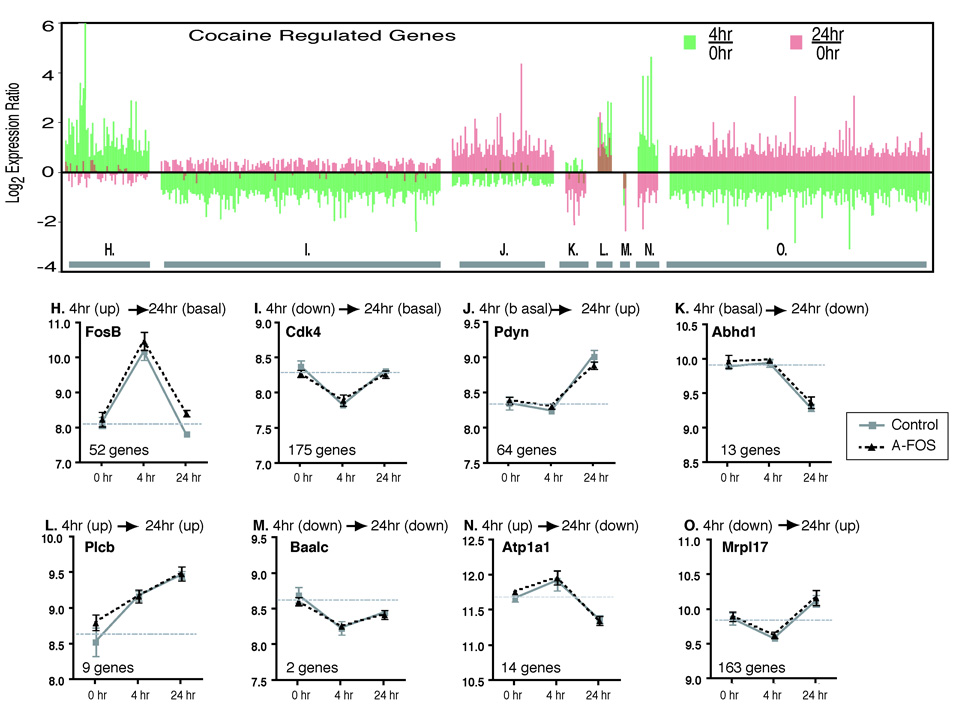
Fig. 6.
Temporal expression pattern of cocaine regulated genes. The regulation of genes by cocaine was determined by comparing the basal (combined A-FOS and control data), 4 hour (combined A-FOS and control data) and 24 hour (control data only) time points using 1-way-ANOVA to identify 824 genes that were differentially expressed following cocaine (p<0.001). These genes were divided into 8 groups (H–O) based on their temporal expression pattern as described in the methods. The upper chart, organized by group, displays the data for each of the 824 genes showing the log2 expression ratio of 4 hours/saline (green bars) and 24 hours/saline (red bars). The lower charts show an example from each group and displays the mean normalized log expression values and standard errors from the Affymetrix chip data for both A-FOS expressing and control mice at saline, 4, and 24 hours after a single injection of cocaine. The horizontal gray bar indicates the average expression value of the 0 hour time point (basal expression) for each gene. Additionally, the graphs contain the official gene symbol (from the National Center for Biotechnology Information Entrez Gene Database) and the number of genes in each group. The genes are FBJ osteosarcoma oncogene B (Fos-B), cyclin-dependent kinase 4 (Cdk4), prodynorphin (Pdyn), chondroitin sulfate proteoglycan 3 (Cspg3), homer homolog 1 (Homer1), brain and acute leukemia, cytoplasmic (Baalc), fos-like antigen 1 (Fra1) and mitochondrial ribosomal protein L17 (Mrpl17).

