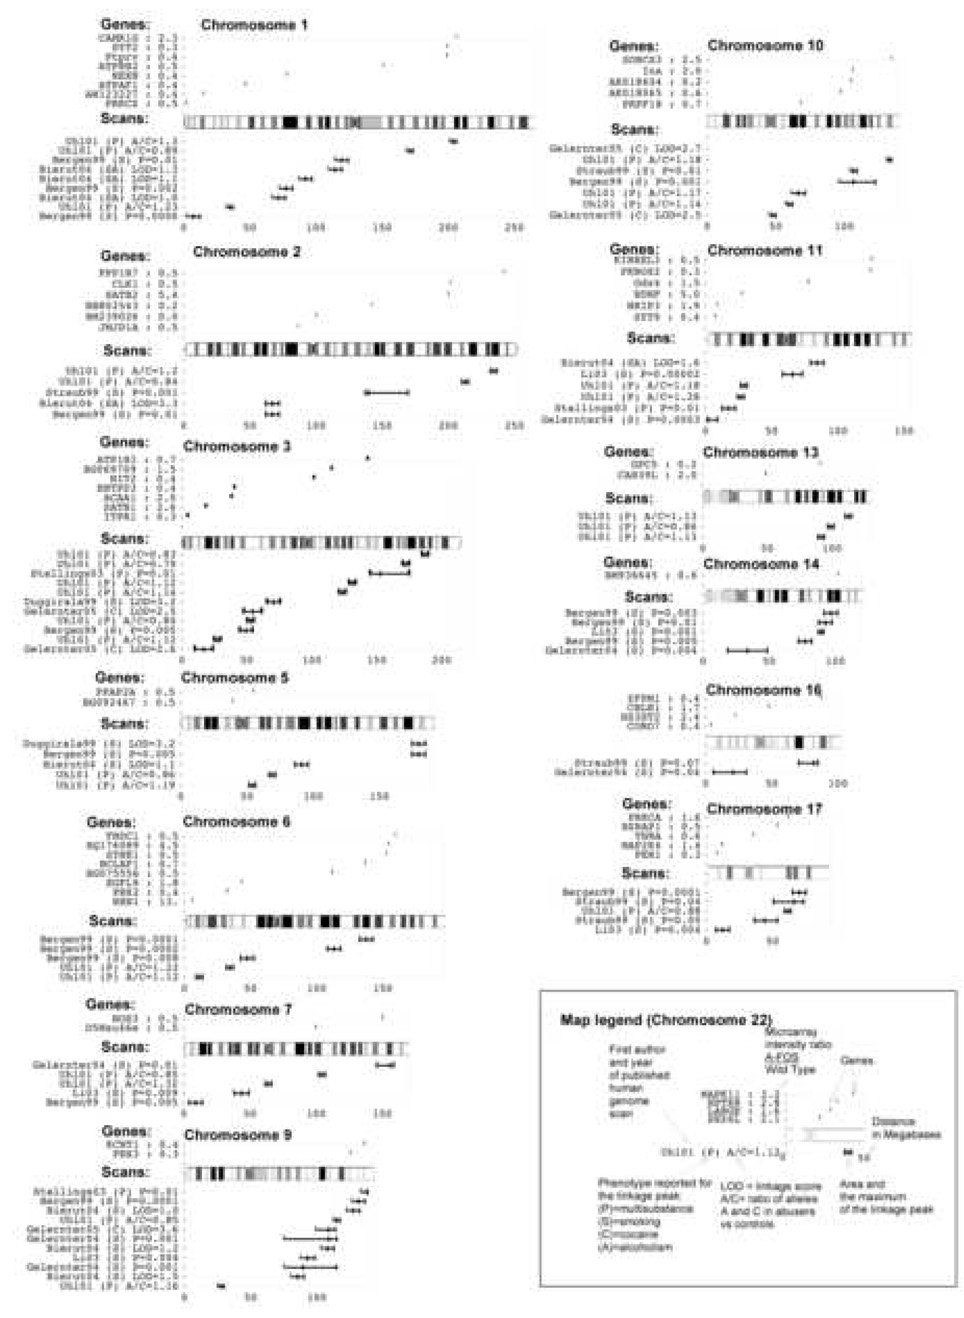
Fig. 7.
Linkage Map. The graph displays the physical location on 13 chromosomes of identified loci from human genome scan studies of addiction. Additionally, the location of the human orthologs of the 84 genes differentially expressed in A-FOS animals following cocaine are displayed. The map legend is given using chromosome 22 as an example.

