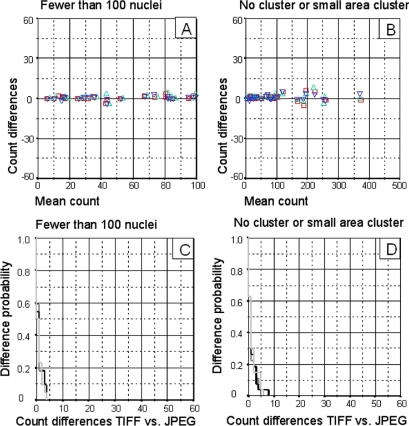
Figure 2.
Results obtained by automatic quantification from low-complexity images (fewer than 100 nuclei/image, with no cluster or small-area cluster). A. Superimposed Bland-Altman graphs comparing count differences between TIFF and JPEG images. TIFF vs. 3× compression JPEG (□), TIFF vs. 23× compression JPEG (▵), TIFF vs. 46× compression JPEG (▿). B. Superimposed Kaplan-Meier curves comparing the probability of difference between TIFF and JPEG image counts. TIFF vs. 3× compression JPEG (▩), TIFF vs. 23× compression JPEG (▪), TIFF vs. 46× compression JPEG (□).

