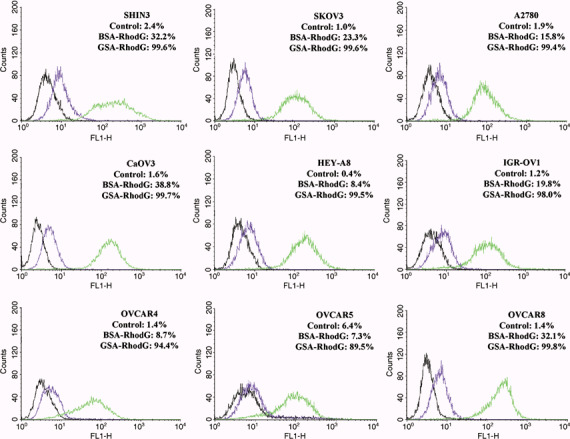
Figure 1.

Flow cytometry results from nine human ovarian adenocarcinoma cell lines after incubation with either 3 µg/mL galactosyl serum albumin (GSA)–rhodamine green (RhodG) (green lines) or bovine serum albumin (BSA)–RhodG (purple lines). Untreated controls (black lines) are also shown. The percentage of fluorescent‐gated cells, which corresponds to the number of cells that were labeled by the protein–fluorophore conjugates, is shown for each experimental condition. The percentage of fluorescent‐gated cells and mean fluorescence intensity is highest after GSA–RhodG incubation for all nine cell lines.
