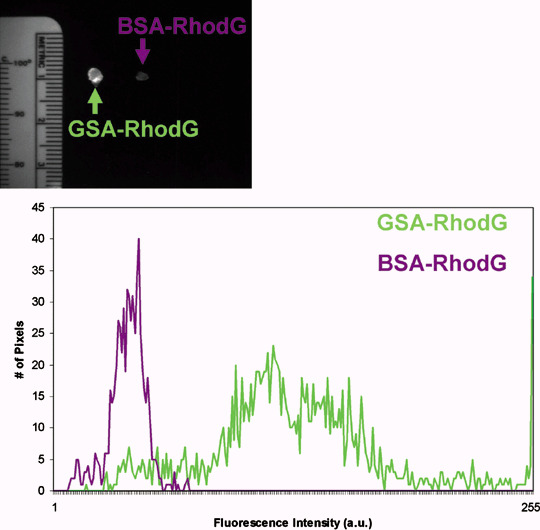
Figure 4.

(Top) Side‐by‐side ex vivo fluorescence image of tumor nodules derived from SKOV3 tumor‐bearing mice treated with galactosyl serum albumin (GSA)–rhodamine green (RhodG) (left) and bovine serum albumin (BSA)–RhodG (right). Using ImageJ software, a region of interest was drawn around each nodule and their fluorescence intensity plotted on a histogram (bottom). Administration of GSA–RhodG resulted in higher fluorescent intensity (green line) in tumors than did BSA–RhodG administration (purple line) (P < 0.0001). Although not shown, similar results were obtained with nodules derived from OVCAR5 and OVCAR8.
