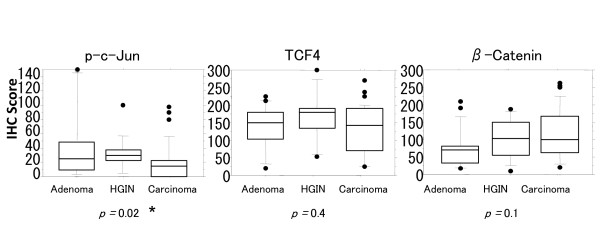
Figure 2.
Nuclear expression of p-c-Jun, TCF4 and β-Catenin in adenomas (n = 19), HGINs (n = 14) and adenocarcinomas (n = 35). Only p-c-Jun expression was significantly different. Adenomas and HGINs showed higher immunohistochemistry (IHC) scores than adenocarcinomas. Horizontal lines, median; boxes, 25% to 75% range; brackets, 10% to 90% range; circles, points outside the 10% to 90% range. *p < 0.05 by Kruskal-Wallis test.

