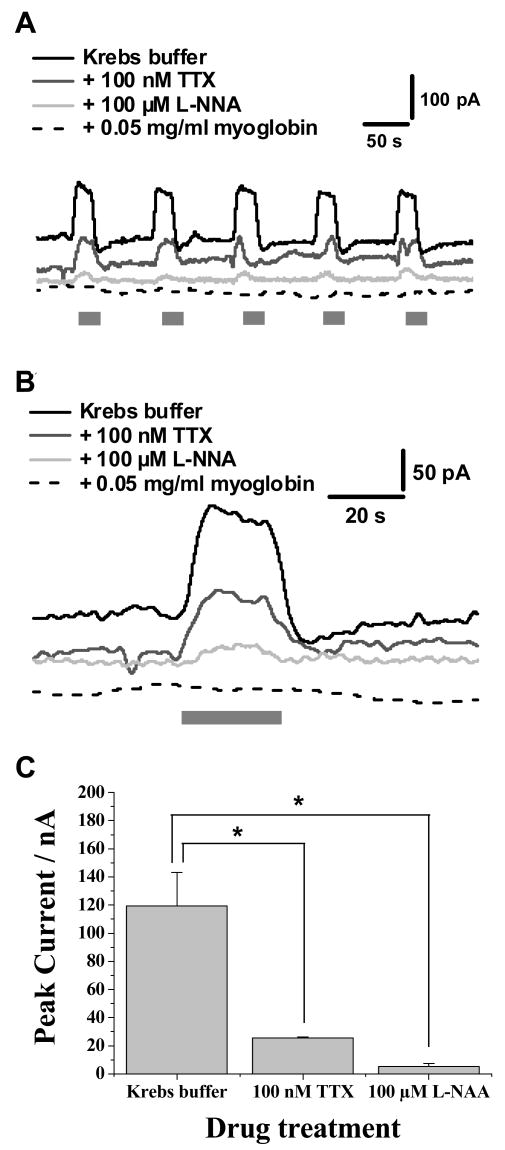
Figure 3.
Detection of nitric oxide from ganglionic regions of the myenteric plexus. In all experiments, the grey bar indicates the period during a 20 s superfusion with 1 μM nicotine. This stimulation is provided for all experiments and only the bath medium is changed when the effects of drug treatments are studied. (A) shows the response elicited from drug treatments, where responses are all carried out at 1 V. Responses in the presence of 100 nM TTX, 100 μM L-NNA and 0.05mg/ml myoglobin are shown. (B) shows an individual response from (A). (C) shows a summary of the changes in nitric oxide levels detected following drug treatments, where results show mean ± SEM, n = 3, *p< 0.001 (paired, two way t-test).

