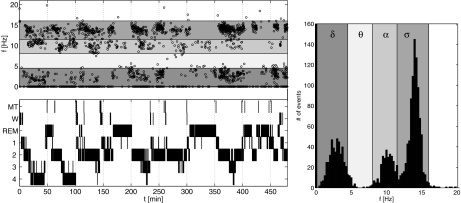
Fig. 2.
Detected oscillatory events in a single night (black dots represent single events), hypnogram (MT, movement time; W, waking, REM, rapid eye movement sleep; 1 to 4, nonrapid eye movement sleep stages 1 to 4), and corresponding histogram of the event frequencies. Colors indicate the different frequency bands

